


Document Creation Information
This blog was written entirely by a human, without using AI to generate ideas or develop the content. AI was used solely to review grammar and improve readability. Any use of AI will be explicitly acknowledged and referenced. All images included in the blog were generated using ChatGPT 5.5. I don’t receive any financial benefit from sharing my knowledge. knowledgemanagement.co.za is a side project that allows me to document and share what I’ve learned. I also use it as a reference in discussions, helping me explain concepts without having to repeat myself each time.
Why I Am Writing This Article
Since I wrote my first blog about Knowledge Graphs on 3 October 2022, a lot has changed. Back then, before the whole AI explosion, Graph Databases and Knowledge Graphs were considered a niche market. Things have changed drastically since then.
This is quite a lengthy blog, but I believe it provides a comprehensive, holistic view of the subject.
Looking at DB-Engines — Compare 161+ Graph Databases, it is clear that there is significant activity in the graph database space. Another useful source of information is OSS Insight, which provides insights into open-source project activity. Take a look at both sources and draw your own conclusions.
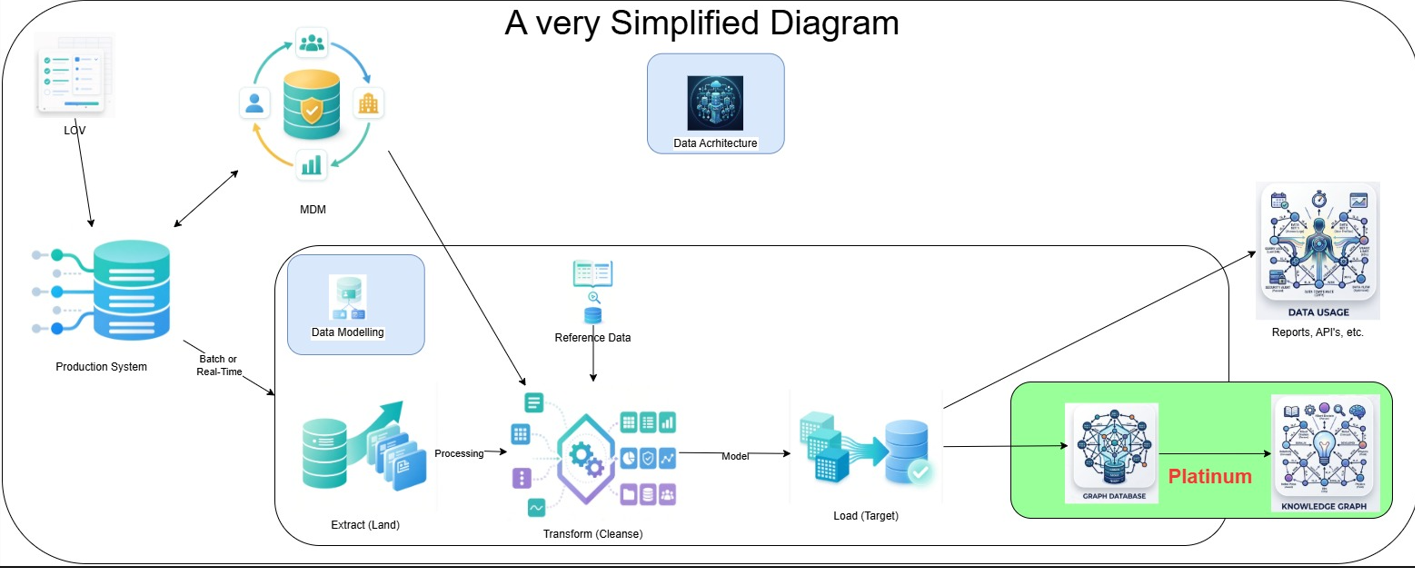
In today's world, the fundamental process of moving data has not changed significantly. The concept of a three-phase approach remains relevant, although it is described using many different terms. The process involves acquiring the data (in real time or by landing it in a designated environment - Bronze), transforming it (Silver) into a usable format, and loading it into the target system (Gold), where it can be consumed by various interfaces and applications (Reports, API’s, etc.).
And remember the age-old principle:
“Garbage in, garbage out.”
No matter how advanced our technology becomes, this will never change.
There are several reasons for adopting this approach, including data quality, consistency, governance, performance, and the separation of data processing from the systems that generate and consume the data.
Data Architecture vs Data Modelling
The distinction between Data Architecture and Data Modelling is often misunderstood, with the two concepts frequently confused or used interchangeably. One example is the Bronze, Silver, and Gold layers, which form part of Data Architecture, not Data Modelling.
- Data Architecture defines the overall strategy and structure for managing data across an organisation, including where data resides, how it moves between systems, and how it is governed and consumed.
- Data Modelling defines how data is structured and related, including entities, attributes, relationships, and business rules.
In simple terms: Data Architecture defines the bigger picture; Data Modelling defines the structure and relationships of the data.
Keep Models, Architectures, and Practices Separate
There is often confusion when people talk about modern data modelling. Some terms describe how we model the data. Other terms describe how we move, store, govern, or manage it. These are related, but they do not all answer the same question:
- A data model describes how information is represented: entities, relationships, events, measures, and rules.
- A data architecture describes how data is stored, moved, processed, and made available.
- Management and engineering practices cover ownership, quality, change, transformation, and sharing.
An organisation may use several of these approaches together. They should not all be treated as competing modelling methods.
Data Models for Different Workloads
| Approach | What it represents | Common use and boundary |
|---|---|---|
| Operational relational and domain models | Entities, attributes, and relationships, commonly in relational tables. Normalisation supports reliable transactions and updates. | Applications and systems of record. These schemas serve different needs from analytical models. |
| Dimensional models | Business processes and measurements in fact tables, with descriptive context in dimensions; often shown as star schemas. | BI, reporting, and decision support. They remain useful on cloud and Lakehouse platforms. |
| Data Vault models | Hubs for business keys, Links for relationships, and Satellites for descriptive attributes and history. | Integrating changing sources where historical traceability matters. Data Vault is a warehouse modelling method, not a general platform architecture. |
| Event and temporal models | Occurrences or changes over time, with details such as event identity, entity key, event time, sequence, and version. | Audit history, change-data capture, replay, and reconstructing state. An event model describes data; streaming describes a processing pattern. |
| Graph and ontology models | Graphs represent entities and relationships. Ontologies formally define domain concepts and relations, and may enable consistency checks or inference. | Useful where connected relationships or explicit, machine-readable domain meaning matter. A graph is not a default substitute for relational or dimensional models. |
| Semantic and ML representations | Semantic models define business-facing entities, measures, and calculations. Feature models define inputs for ML; embeddings and vector indexes support some similarity-retrieval workloads. | Useful for shared measures, production ML, or AI retrieval. These representations do not replace general business models. |
Architecture and Operating Practices
| Pattern or practice | What it describes | Common use and boundary |
|---|---|---|
| Layered Lakehouse architecture | Progressive stages often called Bronze, Silver, and Gold: source-aligned landing, integrated or cleansed data, and outputs for consumers. | Helps separate platform responsibilities. Each layer can contain different data models; the layers are not a modelling method. |
| Streaming architecture | Continuous capture, routing, storage, and processing of event streams, sometimes with retrospective replay. | Low-latency products, telemetry, change-data capture, and reactive applications. It does not prescribe one event model. |
| Data mesh and domain data products | An operating approach that assigns data-product ownership to business domains, supported by a shared platform and federated governance. | Can help large organisations distribute responsibility. It is not a table design. |
| MDM and entity resolution | Reconciles records for core entities across systems through matching, deduplication, stewardship, and sometimes a trusted unified record. | Shared identities such as customers, products, or suppliers. MDM addresses identity and stewardship, not one specific schema pattern. |
| Data contracts and modular transformations | Contracts define producer-consumer expectations for schemas, semantics, quality, ownership, and compatible change. Modular analytics transformations organise code into documented, testable components. | Useful for reliable data products and maintainable pipelines. These practices govern exchange and delivery; they do not define the conceptual data model. |
MDM, Reference Data and LOVs
Other commonly confused data management terms include MDM (Master Data Management), Reference Data, and LOVs (Lists of Values). Traditionally MDM, Reference Data and LOVs are the heart of any data ecosystem.
- MDM (Master Data Management): Manages an organisation’s core business entities, such as customers, products, suppliers, and employees, ensuring consistent and trusted records across systems.
- Reference Data: Standardised values used to classify or describe other data, such as country codes, currency codes, and customer categories.
- LOVs (Lists of Values): A predefined list of permitted values for a particular field, such as Active, Inactive, Pending in a status field.
In short: MDM manages core business entities; Reference Data standardises shared codes and classifications; LOVs define which values users can select or enter in a specific field.
I’m considering writing a blog about MDM, Reference Data, and Lists of Values (LOVs), as there seems to be considerable confusion surrounding these concepts and how they differ.
Other Challenges
Typically, each Business Unit operates within its own technical environment, leading to duplicated information, increased costs, knowledge hoarding, inconsistent results, and different interpretations of terms and organisational language (see the Graph Glossary). These silos also limit interoperability between systems, making it difficult to share and reuse information effectively. The Data Warehouse, in all its forms, is here to stay for the foreseeable future.
Think of it as the ‘COBOL’ of Data Management. In my opinion, the main reasons for introducing Data Warehouses in the first place were limited hardware capabilities, data history tracking and the need to avoid direct access to production servers. These were, and remain, valid concerns.
Since then, cloud computing has emerged, fundamentally changing the landscape. New technologies can now store and process vast amounts of data at unprecedented speeds, disrupting traditional approaches to data architecture and data modelling. These changes have also challenged traditional data warehousing methodologies, bringing renewed attention to the contrasting approaches of Bill Inmon and Ralph Kimball, which shaped data warehousing in the early days. Enterprise reporting tools rely on this architecture.
The Prediction
I believe two streams will shape the future of Graph Databases and Knowledge Graphs.
- The first will continue to focus on existing Graph Database and Knowledge Graph implementations.
- The second, which I believe will gain momentum, will focus on creating Graph Databases and Knowledge Graphs from existing target systems, using modern data modelling techniques to transform operational data into connected, meaningful information.
The target systems, including legacy platforms (think of them as the ‘COBOL’ of Data Management), will remain relevant for the foreseeable future. Regardless of how data architectures evolve, organisations will still need to extract, cleanse, validate, and contextualise data to turn it into reliable information. The opportunity lies in using this information to build Knowledge Graphs that connect data across systems and business domains.
This approach could help organisations break down data silos, improve interoperability, and establish a shared understanding of business concepts. However, achieving this will require careful consideration of interoperability standards from the outset. I also expect GQL (Graph Query Language) to become increasingly important as graph technologies mature. As an international standard for querying graph data, GQL could play a role comparable to SQL in the relational database world, supporting more consistent ways of working with graph data across different technologies.
I also believe that Graph Databases and Knowledge Graphs will increasingly challenge the traditional dominance of reporting tools as the primary means of understanding business information. Rather than presenting data only through predefined reports and dashboards, Knowledge Graphs can reveal how entities, processes, and concepts relate across an organisation. By connecting data to real-world business concepts through ontologies, they provide a foundation for discovering relationships, breaking down information silos, and enabling AI applications to work with more structured, contextualised information.
My prediction is not that Knowledge Graphs will replace existing data platforms, warehouses, or reporting tools. Rather, they will become an increasingly important part of the data ecosystem, complementing these technologies and providing a connected view of organisational knowledge that traditional approaches may struggle to deliver on their own. For the sake of argument, let’s call it the ‘Platinum’ layer.